Thursday, June 18, 2020

Use Execute Action Parameters for Feeding Events to a Ticketing System

SQL Sentry Event Manager uses a system of conditions and actions for handling events. Basically, you define one or more actions to be taken as the result of a pre-defined condition being met. There are over a hundred pre-defined conditions that range from a SQL Server Agent job failing to a runtime threshold being exceeded for a T-SQL query, to the minimum value threshold for a performance counter being broken. Applicable actions can then be taken once the condition is met. Whether a condition supports a specific action really just depends on whether or not that action makes sense in that context. For example, “Run QuickTrace” is not an action for the “SQL Server: Deadlock” condition, because when a deadlock is detected the event has already occurred, and the QuickTrace would not contain anything relevant.

Two of the actions that are available for just about every action though, are “Execute Process” and “Execute SQL”. These two actions will allow you to execute either a Windows process, or a T-SQL command sequence on a specified server that is watched by SQL Sentry when the associated condition is met. This can be useful for several reasons, but what makes them even better is that ability to pass all of or specific parts of the event data as parameters to be used by that process or T-SQL batch.

A great use for the above feature is in automatic generation of technical incident records for ticketing systems. You can monitor for an event, and have it sent directly to your ticketing system for review by front line technicians providing all the information they need to make decisions without ever touching a keyboard, or even being present for that matter. For the rest of this post, I’ll go over a way to do just that, and hopefully it will spark some good ideas for anyone reading.

I’m going to assume that we’re already monitoring the server with SQL Sentry Event Manager, so from this point we want to choose a good candidate condition. One that is pretty common for a situation like this is “SQL Server: Agent Job Failure.” This condition is met when a SQL Server Agent job that is watched by SQL Sentry Event Manager logs a failure. We’ll enable the “Execute SQL” action for a backup job, as illustrated below.

image
Job, Condition, Action

At this point we’ve got everything enabled, and the SQL Sentry service will attempt to execute a T-SQL command batch whenever this job fails. We do still have something extremely important missing though, and that is what T-SQL to run, and where to run it.

We want to not only call a stored procedure that will create a support ticket, but also pass information from the event that can be used by a technician to locate and resolve the problem. In addition, we want to pass in a custom value of our own that will help the ticketing system classify and prioritize this incident.

The SQL Sentry feature that is going to allow us to do all of this is called “Execute Action Parameters.” You can read our documentation on this feature in our online help here: http://www.sqlsentry.net/help/ug/?System_Parameters.html, but we’re also going to spend some time setting this up and writing some code below.

For the purpose of this post, we’re going to keep it simple. I’ve created a small database called “Ticketing” and added the following table definition:

CREATE TABLE Tickets
(
    TicketID int NOT NULL identity(1,1)
        CONSTRAINT PK_Tickets_TicketID
            PRIMARY KEY CLUSTERED (TicketID),
    Title nvarchar(128) NOT NULL,
    [Description] nvarchar(2000) NOT NULL,
    ClassCD nchar(3) NOT NULL,
    PriorityHint tinyint NOT NULL
)

Obviously, a real ticketing system will require more information, but the basics are here, as well as two columns (ClassCD and PriorityHint) we can use to demonstrate custom user parameters.

I will also use the following stored procedure to populate the Ticketing table:

USE Ticketing;
GO
 
CREATE PROC InsertTicket
    @Title nvarchar(128),
    @Description nvarchar(2000),
    @ClassCD nchar(3),
    @PriorityHint tinyint = 0
AS
    
INSERT INTO [Ticketing].[dbo].[Tickets]
           ([Title]
           ,[Description]
           ,[ClassCD]
           ,[PriorityHint])
     VALUES
           (@Title
           ,@Description
           ,@ClassCD
           ,@PriorityHint)
GO

To this point it’s all very straight forward. We have a data table for storing ticketing data, and a simple stored procedure for populating it.

The interesting part comes when I define the T-SQL to run for my Execute SQL action. Below I will list the raw T-SQL as well as what it should look like in the actions configuration area of the SQL Sentry console. Then I will explain the special elements we see in the code and what they mean.

Entering the T-SQL command for the Execute SQL command is pretty easy. It’s done in the same area of the console application that was used to enable the “Execute SQL” action.

As seen below, you can select which server to execute the command on, and enter the command itself. Remember that only those servers that are monitored by SQL Sentry Event Manager will be listed in the “Server” drop-down.

image

I’m going to select my local server, since that’s really the only one I am monitoring right now, and enter the following for my “T-SQL Command Text”.

EXECUTE Ticketing.dbo.InsertTicket
    @Title = '<%ObjectType%> <%ObjectName%> Failure'
    ,@Description = '<%ObjectType%> <%ObjectName%> has encountered a failure on server [<%ServerName%>]'
    ,@ClassCD = '<%CLASS%>'
    ,@PriorityHint = 2

At first glance, this is just a normal execute statement, but there are some interesting elements within the string literals that go along with event processing in SQL Sentry, and deserve some additional explanation.

First, any time you see the following format <%…%> in this context, it is telling SQL Sentry that we want to pass some part of the event data as a parameter instead of just keeping the literal text. Take for instance “<%ObjectName%>.” Before this command is executed, any instance of “<%ObjectName%>” will be replaced with the name of the object that caused the event. In this case it will be our backup job “Backup User DBs – FULL.” These parameters are all self-explanatory of what information they will inject into the command, except for one. The “<%CLASS%>” parameter is special. The “<%CLASS%>” parameter is what we call a “User Parameter”, and I will go into more detail about that in a bit.

So, given this command, when my backup job fails, I should get a row in the Tickets table telling me that I need to investigate this tragic event. Now I’ll force the job to fail, and we can see it on the SQL Sentry event calendar, and I’ll also list the contents of the Tickets table.

image

Above you can see the job failure and the detail for the steps in the job. This job simply threw an error with the message “CLASS=PRD.” That really doesn’t mean much, but it becomes important when we look at the user parameter in a bit. Now let’s see what we end up with in the Tickets table below:

image

My execute action parameters were replaced by meaningful information about the event. I know what job failed, and what server it failed on, and I can go investigate what happened using my SQL Sentry calendar view.

If this were a database for a real ticketing system, I’m sure several members of the technical staff would have seen it, and it would be classified and prioritized. Notice the “Class CD” which I mean to stand for “Class Code” and “Priority Hint” which I intend to be used to hint at the priority level.

Let’s assume that “PRD” stands for “Production” in a list of codes somewhere, and that “2” is hinting at a priority of 2. You can see how I could send in a custom parameter from my event output, or just a literal value, such as the priority hint.

The error I raised in the job step is where I got the ClassCD from. I could just as easily have done this with a code comment, print statement, or other mechanism since all I need for this to work is for the NAME=VALUE (in this case CLASS=PRD) set to be somewhere in the output of the event. I put it in the error message here because I knew I was going to make the job fail, and it was just quicker. It’s really just a T-SQL RAISERROR statement. I have it listed below:

RAISERROR ('CLASS=PRD', 16, 1);

This is the user parameters feature that I was discussing earlier. I could embed any number of these into the output of an event, and use them to control processing of the specialized event data upon generating the support ticket. All that is required is that NAME=VALUE pair. Your parameter name will be in the following format: <%NAME%>. In my case it was <%CLASS%>.
 
And that pretty much covers it. You can imagine some of the things you can do with this. You can even get really creative, and pass the entire event message in to parse out pieces that we may not have thought about for pre-defined parameters.
 
Now, there is a second action that these parameters can be used with called “Execute Process”. This action can be used to execute a Windows process, but the parameters work the same way, except in that case they would be command line switches. Again you can find the details on usage in our online documentation.
 
I hope that this tutorial sparks some great ideas for SQL Sentry users, and as always the SQL Sentry support team is happy to help with your implementations of SQL Sentry features, so just ping us if you are interested in trying something like this out.
 
Until next time,
-JRH

Thursday, February 25, 2010

Auto-Kill Long Running Blocks on a SQL Server Monitored by SQL Sentry Performance Advisor

A customer recently came across a problem in which a third-party system was causing long block chains on one of his servers. The best solution he could come up with was really just to kill the blocking SPID when this happens. Knowing that SQL Sentry monitors for blocks and tracks their duration, he asked if there was a way to automate killing the blocking SPID after a specified duration.

This is not something that is built into SQL Sentry as standard functionality, but with some creative thought we were able to come up with a solution using existing SQL Sentry functionality combined with some out-of-band use of one of the remote procedures SQL Sentry employs on a monitored server.

First and foremost we need a way to ID the blocking SPIDs at the head of any block chains. We also need a way to target only the long running blocks, not all of them.

On every SQL Sentry Performance Advisor monitored server, a few utility objects are created in the MSDB database. These are used to reduce network chatter between the SQL Sentry server and monitored SQL Servers. One of these objects is called “spGetBlockInfo_20” (the _20 is just a versioning mechanism, please don’t get stuck on it). This is a stored procedure that can provide us with information about blocked and blocking processes and includes useful information like the wait time, database name, time of last batch, login name and plenty of other things that I’ll skip for brevity. It is the same mechanism that provides raw block information to the '”Blocking SQL” tab in SQL Sentry Performance Advisor.

My first instinct was to write a simple procedure that will load the block information into a temp table and use a cursor to build a dynamic kill statement, finally executing the statement with sp_executesql. It would have one parameter that simply specified the number of minutes since the last batch to use for block duration. This would be done without the cursor due to the original intention to kill multiple blocks, and it could possibly go that way again some day, so it was left as a cursor for now. The first cut of this is below:

First Draft

CREATE PROCEDURE dbo.spKillLongRunningBlocks 
  @minutesSinceLastBatch int
AS
CREATE TABLE #tmp
    (
      spid smallint,
      blocked smallint,
      waittype binary(2),
      waittime int,
      waitresource nvarchar(256),
      dbname sysname,
      last_batch datetime,
      ecid smallint,
      hostname nchar(128),
      [program_name] nchar(128),
      loginame nchar(128),
      cmdtext ntext,
      waittext nvarchar(1000)
    );
INSERT #tmp
  EXEC spGetBlockInfo_20;
DECLARE cspids CURSOR FAST_FORWARD FOR
    SELECT spid, last_batch
    FROM #tmp
    WHERE #tmp.blocked = 0
    AND DATEDIFF(minute, #tmp.last_batch, GETDATE()) >= @minutesSinceLastBatch;
DECLARE @spid int;
DECLARE @lastBatch datetime;
DECLARE @killCmd nvarchar(2000);
OPEN cspids;
FETCH NEXT FROM cspids INTO @spid, @lastBatch;
SET @killCmd = '';    
IF @@FETCH_STATUS = 0
BEGIN
  SET @killCmd =  @killCmd + 'KILL ' + CAST(@spid AS nvarchar(5)) + ';';
  EXEC sp_executesql @killCmd;
END;
  
CLOSE cspids;
DEALLOCATE cspids;
DROP TABLE #tmp;

This worked pretty well actually, until I ran the procedure code by the product architect for SQL Sentry Performance Advisor Greg Gonzalez who quickly pointed out that for RPC processes that last_batch field can often show up as ‘01/01/1900’. This would create a situation where we might kill the wrong processes, so I had to find another way to determine the duration. So, after a bit of though I concluded that the process with the highest wait time and the SPID in question as it’s blocker should provide the most accurate duration. Luckily, “waittime” is already part of the output of “spGetBlockInfo_20”. It is in milliseconds, so I had to multiply the input by 60 then by 1000 to convert it for comparison. This next version includes this change on lines 26-28:

Edited for Duration Accuracy

CREATE PROCEDURE dbo.spKillLongRunningBlocks 
  @minutesSinceLastBatch int
AS
CREATE TABLE #tmp
    (
      spid smallint,
      blocked smallint,
      waittype binary(2),
      waittime int,
      waitresource nvarchar(256),
      dbname sysname,
      last_batch datetime,
      ecid smallint,
      hostname nchar(128),
      [program_name] nchar(128),
      loginame nchar(128),
      cmdtext ntext,
      waittext nvarchar(1000)
    );
INSERT #tmp
  EXEC spGetBlockInfo_20;
DECLARE cspids CURSOR FAST_FORWARD FOR
    SELECT spid, last_batch
    FROM #tmp
    WHERE #tmp.blocked = 0
    AND (SELECT MAX(t2.waittime) 
       FROM #tmp t2 
       WHERE t2.blocked = #tmp.spid) > CAST((@minutesSinceLastBatch * 60) * 1000 as int);
DECLARE @spid int;
DECLARE @lastBatch datetime;
DECLARE @killCmd nvarchar(2000);
OPEN cspids;
FETCH NEXT FROM cspids INTO @spid, @lastBatch;
SET @killCmd = '';    
IF @@FETCH_STATUS = 0
BEGIN
  SET @killCmd =  @killCmd + 'KILL ' + CAST(@spid AS nvarchar(5)) + ';';
  EXEC sp_executesql @killCmd;
END;
  
CLOSE cspids;
DEALLOCATE cspids;
DROP TABLE #tmp;

We need the most accurate solution possible. After all, we are forcibly ending running processes sight unseen on our DBMS server. With that in mind I ran the procedure by architect and lead developer Brooke Philpott. Transforming the raw block data from “spGetBlockInfo_20” into what you can see in the Blocking SQL tab in Performance Advisor is a very complicated process. We can’t assume that all blocks that may still be active after the threshold is met are supposed to be killed. We didn’t have to discuss this very long for me to buy in to the fact that we needed to narrow the margin of error a bit more.

SQL Sentry Event Manager has a feature called Execute Action Parameters. This feature allows one to pass all or parts of the SQL Sentry notification message in as a parameter to the target of an Execute SQL or Execute Process action. For the purpose here, it was easiest to pass in the full message an execute command similar to the following:

EXEC msdb.dbo.spKillLongRunningBlocks '<%MessageText%>'

The standard “blocking detected” message from SQL Sentry contains something very important in making this work. It lists the entire block chain from top to bottom. A simple example is pasted below:

Example: SQL Sentry Blocking Detected Message

[Connection]:  ICWS1
[Message]: SQL Server Blocking Detected
[Start Time]: 2/24/2010 2:07:46 PM
[Duration]: 57 minutes, 27 seconds
[Minimum Duration Threshold]: 5 seconds
------------------------------------------------------------------------
[Timestamp (Local)]: 2/24/2010 3:05:14 PM
[Timestamp (UTC)]: 2/24/2010 8:05:14 PM
[Generated By]: SQL Sentry 5.5 Server [ICWS1]
[Version]: 5.5.20.0
[Monitor Type]: SqlServerBlockDetector
[Condition]: SQL Server: Blocking SQL
[Response Ruleset]: Long Running Blocks
------------------------------------------------------------------------
SPID at Head of Blocking Chain:
SPID [ecid]: 81 [0]
Client Machine: ICWS1
Application: SQL Server Agent: Job 'BLOCK_TESTA'
Login Name: NT AUTHORITY\NETWORK SERVICE
Last Batch: 2/24/2010 2:07:41 PM
Wait Type: WAITFOR
Wait Time: 00:00:00
Database: SSTESTS
Command Text:
WAITFOR DELAY '00:00:01'
------------------------------------------------------------------------
Blocked SPID:
SPID [ecid]: 82 [0]
Blocked By SPID: 81
Client Machine: ICWS1
Application: SQL Server Agent: Job 'BLOCK_TESTB'
Login Name: NT AUTHORITY\NETWORK SERVICE
Last Batch: 2/24/2010 2:07:46 PM
Wait Type: LCK_M_RS_S
Wait Time: 00:57:27
Database: SSTESTS
Command Text:
SELECT DISTINCT *
FROM TestTable ORDER BY ID DESC
------------------------------------------------------------------------

Note that we can trust that the correct entries are gathered from the message since we know that the head of the block chain is always the first entry in the message. The parsing calls can start from the beginning of the message for each value to parse.

All of the information necessary to narrow the selection down to the exact SPID we want to kill is in there. All that is needed from this point is some creative TSQL string parsing and type conversion. In the final version of the procedure I’ve early on where we’re parsing the blocking SPID, client machine, login name and database name from the message text. Since technically the SPID number could have been reused by this time, we need a way to ID more values than just SPID number. With all of these values from the message text we can compare using a composite key to identify a specific block. This fully removes the need to test for any wait time at all, placing that burden back on the SQL Sentry server service where it really belongs. As a result, two things happen. First, the part of the where clause in the cursor that constrains the duration is replaced with a final check to make sure there are still processes being blocked by this SPID. Secondly, we no longer have to specify the number of minutes as a parameter.

Some other important improvements in this version include restricting the SPID query to non-system SPIDs (>50). Imagine the horror when you realize that your automated process is killing important work that SQL Server is trying to do. What’s worse, imagine the emails and phone calls. Yikes! I’ve also included some defaulted parameters that can be used to target specific applications, client machines, logins and/or databases. They are null by default, but are useful for targeting only certain blocks instead of everything across the board.

Edited for Composite Key

CREATE PROCEDURE dbo.spKillLongRunningBlocks 
  @messageText nvarchar(2000),
  @targetClientMachine nvarchar(128) = null,
  @targetApplication nvarchar(128) = null,
  @targetLoginName nvarchar(128) = null,
  @targetDatabase nvarchar(128) = null
AS
--PRINT @messageText;
DECLARE @beforeSpidConstant nvarchar(25);
DECLARE @beforeClientMachineConstant nvarchar(25);
DECLARE @beforeApplicationConstant nvarchar(25);
DECLARE @beforeLoginNameConstant nvarchar(25);
DECLARE @beforeDatabaseConstant nvarchar(25);
SET @beforeSpidConstant = 'SPID [ecid]:    ';
SET @beforeClientMachineConstant = 'Client Machine:    ';
SET @beforeLoginNameConstant = 'Login Name:    ';
SET @beforeDatabaseConstant = 'Database:      ';
DECLARE @spidLoc int;
DECLARE @clientMachineLoc int;
DECLARE @loginNameLoc int;
DECLARE @databaseLoc int;
DECLARE  @targetSpid nvarchar(5);
SELECT @spidLoc = CHARINDEX(@beforeSpidConstant, @messageText);
SELECT @clientMachineLoc = CHARINDEX(@beforeClientMachineConstant, @messageText);
SELECT @loginNameLoc = CHARINDEX(@beforeLoginNameConstant, @messageText);
SELECT @databaseLoc = CHARINDEX(@beforeDatabaseConstant, @messageText);
SELECT @targetSpid = 
  SUBSTRING(@messageText, 
        @spidLoc + LEN(@beforeSpidConstant),
        (CHARINDEX(' ', @messageText, @spidLoc + LEN(@beforeSpidConstant))) - (@spidLoc + LEN(@beforeSpidConstant)));
IF @targetClientMachine IS NULL
BEGIN        
  SELECT @targetClientMachine = 
    RTRIM(SUBSTRING(@messageText, 
          @clientMachineLoc + LEN(@beforeClientMachineConstant),
          (CHARINDEX(CHAR(13) + char(10), @messageText, @clientMachineLoc + LEN(@beforeClientMachineConstant))) - (@clientMachineLoc + LEN(@beforeClientMachineConstant))));
END      
IF @targetLoginName IS NULL
BEGIN
  SELECT @targetLoginName = 
    RTRIM(SUBSTRING(@messageText, 
          @loginNameLoc + LEN(@beforeLoginNameConstant),
          (CHARINDEX(CHAR(13) + char(10), @messageText, @loginNameLoc + LEN(@beforeLoginNameConstant))) - (@loginNameLoc + LEN(@beforeLoginNameConstant))));
END        
IF @targetDatabase IS NULL
BEGIN
  SELECT @targetDatabase = 
    RTRIM(SUBSTRING(@messageText, 
          @databaseLoc + LEN(@beforeDatabaseConstant),
          (CHARINDEX(CHAR(13) + char(10), @messageText, @databaseLoc + LEN(@beforeDatabaseConstant))) - (@databaseLoc + LEN(@beforeDatabaseConstant))));                        
END
--PRINT @targetSpid;
--PRINT @targetClientMachine;
--PRINT @targetLoginName;
--PRINT @targetDatabase;
CREATE TABLE #tmp
    (
      spid smallint,
      blocked smallint,
      waittype binary(2),
      waittime int,
      waitresource nvarchar(256),
      dbname sysname,
      last_batch datetime,
      ecid smallint,
      hostname nchar(128),
      [program_name] nchar(128),
      loginame nchar(128),
      cmdtext ntext,
      waittext nvarchar(1000)
    );
INSERT #tmp
  EXEC spGetBlockInfo_20;
DECLARE cspids CURSOR FAST_FORWARD FOR
    SELECT 
      spid, 
      hostname, 
      [program_name], 
      loginame, 
      dbname
    FROM #tmp
    WHERE #tmp.blocked = 0
    AND spid > 50 --Don't kill system SPIDs!!!
    AND (SELECT COUNT(t2.spid) 
       FROM #tmp t2 
       WHERE t2.blocked = #tmp.spid) > 0;
       
DECLARE @spid smallint;
DECLARE @clientMachine nvarchar(128);
DECLARE @application nvarchar(128);
DECLARE @loginName nvarchar(128);
DECLARE @database sysname;
DECLARE @killCmd nvarchar(50);
OPEN cspids;
FETCH NEXT FROM cspids INTO @spid, @clientMachine, @application, @loginName, @database;
SET @killCmd = '';    
IF @@FETCH_STATUS = 0
BEGIN
  --PRINT @targetClientMachine + ' = ' + @clientMachine
  --PRINT @targetApplication + ' = ' + @application
  --PRINT @targetLoginName + ' = ' + @loginName
  --PRINT @targetDatabase + ' = ' + CAST(@database AS nvarchar(128))
  IF(CAST(@targetSpid as int) = @spid 
     AND @targetClientMachine = RTRIM(@clientMachine)
     --Application may not always match, so only use it if it was passed in
     AND isnull(@targetApplication,RTRIM(@application)) = RTRIM(@application)
     AND @targetLoginName = RTRIM(@loginName)
     AND @targetDatabase = CAST(@database AS nvarchar(128)))
  BEGIN
    SET @killCmd =  @killCmd + 'KILL ' + CAST(@spid AS nvarchar(5)) + ';';
    EXEC sp_executesql @killCmd;
  END
END;
  
CLOSE cspids;
DEALLOCATE cspids;
DROP TABLE #tmp;

So now that we have a mechanism in place to kill the process at the head of any long running block chain, we need a way to trigger it. At first we wanted to use the “Max Runtime Threshold” condition in SQL Sentry Performance Advisor for SQL Server Blocking, but this condition only fires when the block has finished, and it doesn’t include all the items that we want from the message text. We could use the “SQL Server: Blocking SQL” condition since it gets fired as soon as any block that meets the collection threshold is detected, but we really only want this to be triggered after a specified amount of time. The solution lies in Response Rulesets. Using a response ruleset we can use the standard Blocking SQL condition with the Execute SQL action in SQL Sentry, and only allow the action to be performed when a specified amount of time has passed. Since response rulesets can be set for each action (as opposed to each condition) we can still send an email, or save a database log of every single block detected, but only execute our kill procedure when enough time has elapsed since the block was first detected.

First, enable the condition for the server where our kill procedure is placed (you can do this globally as well, but you want to make certain the kill procedure exists on every monitored server in that case):

Enable the Execute SQL Action for the Blocking SQL Condition

image 
Note: Learn more about SQL Sentry conditions and actions here: SQL Sentry Training Videos

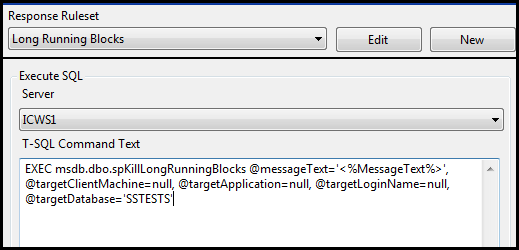
Next, enter the command to execute our block killing procedure. This is the same command discussed above in bold text, but altered to restrict by database. Note that my test database is called ‘SSTESTS’:

Enter the Command for the Execute SQL Action

image

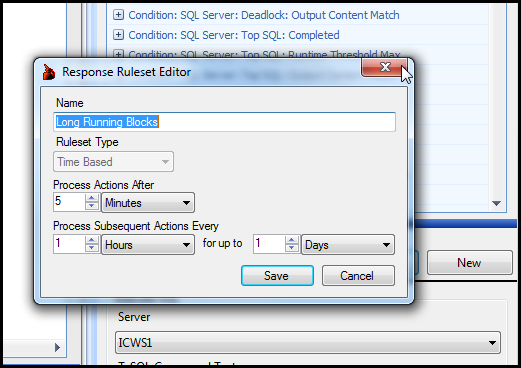
Now, create the response ruleset to only process messages after the block has been active for more than 5 minutes:

Create and Set the Time Based Response Ruleset

image

Conclusion

Now our solution is in place. Any time a block is detected, and continues blocking for more than 5 minutes, our stored procedure will be run killing only the process at the head of that block chain.

This solution takes advantage of some of the more advanced features that SQL Sentry has to offer, and is just one example of the many solutions that can be built using SQL Sentry and a little creativity.

Anyone that is interested in setting this up please just email support at sqlsentry.net and mention this blog entry. Even if you don’t already use SQL Sentry you can try this out using an evaluation copy from here.